

A battery voltage chart is an indispensable tool for any eBike rider. It translates your battery's voltage reading into its real-world state of charge, giving you a much more precise "fuel gauge" than the often-misleading bars on your handlebar display.
For instance, a standard 48V Lithium-ion battery isn't just a flat 48 volts. It's considered 100% full when it reads 54.6V right off the charger and functionally empty when it hits its low-voltage cut-off around 42V. Knowing this specific range is the secret to truly understanding how much juice you have left for your ride.
Why Voltage is Your eBike Battery's True Fuel Gauge
Those battery bars or percentage readouts on your eBike’s display? They're often just educated guesses. Voltage, however, is a direct, physical measurement of the electrical potential energy packed inside your battery's cells.
Think of it like the water pressure in a tank. Higher pressure (voltage) means more water (energy) is ready to flow. As you ride and draw power, that pressure—the voltage—drops in a very predictable way. This makes it the single most reliable indicator of your battery's true state of charge (SoC).
Once you get comfortable reading your eBike's voltage, you can:
- Accurately gauge your remaining range: No more guessing if you can make it up that last big hill.
- Prevent sudden power cut-offs: Avoid the frustrating experience of being stranded when your display bars plummet from three to zero without warning.
- Keep an eye on battery health: If your battery no longer reaches its usual full-charge voltage or holds it for as long, it’s a clear sign that it's aging.
The chart below gives a quick visual of the typical working voltage range for a common 48V eBike battery.
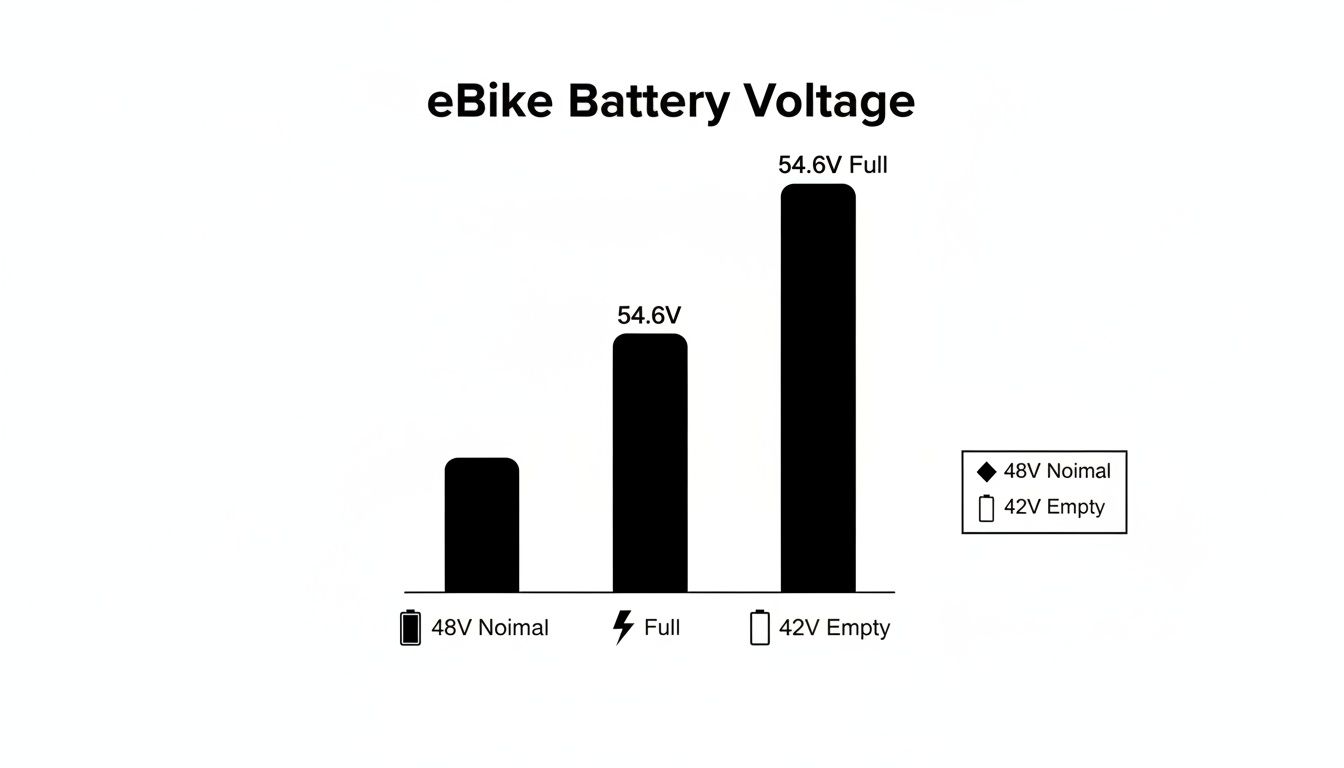
As you can see, the "nominal" voltage is really just an average. The actual operational range is much broader. The detailed charts in the following sections will help you turn these voltage numbers into practical knowledge for every ride.
eBike Battery Voltage At-a-Glance
For a quick reference, here’s a summary of the voltage ranges for the most common eBike batteries you'll encounter. These numbers represent the two most critical points: 100% charged (right after charging) and 0% (when the Battery Management System, or BMS, will cut power to protect the cells).
| Battery Pack (Nominal Voltage) | Chemistry | Fully Charged Voltage (100% SoC) | Cut-Off Voltage (0% SoC) |
|---|---|---|---|
| 36V Battery Pack | NMC/Li-ion | 42.0V | 30.0V |
| 48V Battery Pack | NMC/Li-ion | 54.6V | 39.0V - 42.0V |
| 52V Battery Pack | NMC/Li-ion | 58.8V | 42.0V |
| 48V Battery Pack | LiFePO4 | 58.4V | 40.0V |
These values are your key benchmarks. Knowing your battery’s fully charged voltage confirms it’s taking a full charge, and understanding the cut-off voltage helps you know when to head home before the motor cuts out. We'll dive deeper into what the numbers in between mean in the next sections.
Why Voltage Is a Better Fuel Gauge Than Bars
We've all been there: the battery indicator on your eBike display—those simple bars or a percentage—can feel a bit like a guess. They're handy for a quick glance, but they don't always tell the whole story. If you want the real, unvarnished truth about your remaining power, you need to look at your battery’s voltage.
Think of voltage as the electrical pressure inside the pack. When your battery is fresh off the charger, it's at its highest pressure, ready to push out maximum energy. As you ride and draw current, that pressure drops in a fairly predictable way. This drop directly reflects how much chemical energy is left inside.
The Problem with Bars and Percentages
So why are those simple indicators often wrong? They are basically just little programs trying to translate a live voltage reading into a simplified graphic. The problem is, they get easily fooled by what you're doing on the bike at that exact moment.
For instance, have you ever hit a steep hill and watched your battery bars plummet, only to see them jump back up when you reach the top? That’s a classic example of "voltage sag." When your motor works hard, it pulls a massive amount of current, causing a temporary dip in the battery's voltage.
Key Takeaway: Your display might show you losing two bars on a climb, but they reappear on flat ground. Your battery isn't magically regenerating; the voltage is simply recovering now that the heavy load is gone.
This is exactly why just watching the bars can give you some serious range anxiety or, even worse, leave you stranded. By learning how to read a battery voltage chart, you can see past these temporary sags and get a true picture of how much juice you actually have left.
It’s the difference between guessing and knowing. Understanding voltage lets you make smarter decisions on the trail, like whether you’ve got enough in the tank for one more loop or if it’s time to point it toward home.
Understanding Your 48V Lithium-Ion (NMC) Voltage Chart
The 48V Lithium-Ion (NMC) pack is the absolute workhorse of the modern eBike world. If you bought an eBike recently, this is almost certainly what’s powering your ride. Getting a handle on its voltage range is the secret to truly mastering your bike and predicting how much juice you have left.
Don't get too hung up on the "48V" label—that’s just its nominal, or average, voltage. In reality, the voltage constantly changes as you ride. This is where a detailed battery voltage chart becomes your most reliable tool, turning that number on your display into a real-world estimate of your remaining range.
Key Voltage Thresholds For A 48V Pack
Most of these battery packs are made of individual lithium cells wired together in a 13-series (13s) configuration. Each cell is rated at a nominal 3.7V, but it actually reaches 4.2V when fully charged. Do the math, and you get the pack’s true maximum voltage: 54.6V (13 x 4.2V = 54.6V).
On the other end of the spectrum, the lowest safe point for each cell is about 3.0V to 3.2V. To prevent irreversible damage, your bike’s built-in Battery Management System (BMS) is designed to cut power when the total pack voltage hits its low-voltage cutoff, which is typically set somewhere between 39V and 42V.
Practical Tip: The one number to commit to memory is 54.6V. When your multimeter shows this reading a few minutes after you take the battery off the charger, you know your pack and charger are healthy and you’re starting with a genuine 100% charge.
48V Lithium-Ion (NMC) Battery Voltage vs State of Charge (SoC)
Knowing your battery's voltage helps you translate a simple number into a gut feeling for how much ride you have left. The table below provides a solid reference for what your voltage reading means in terms of the estimated percentage of charge remaining.
Keep in mind that a battery's voltage drop isn't perfectly linear. It falls off quickly right at the start and then again at the very end, but it stays remarkably stable through the bulk of the discharge cycle. This chart will help you get a feel for that curve.
| Voltage (V) | Estimated State of Charge (%) | Riding Condition Notes |
|---|---|---|
| 54.6V | 100% | Fresh off the charger; you'll have maximum power and torque. |
| 52.5V | 90% | Still feels very punchy with almost no noticeable performance drop. |
| 50.4V | 80% | Excellent power, now settling into the main part of the ride. |
| 49.1V | 70% | Welcome to the stable mid-range; perfect for long-distance cruising. |
| 48.0V | 50% | You're at the halfway mark. You might feel a slight dip in acceleration. |
| 46.8V | 40% | Performance is noticeably softer now, especially when tackling hills. |
| 45.5V | 30% | Time to start planning your route home; power assist is limited. |
| 44.2V | 20% | You'll see a significant reduction in power. Avoid steep climbs. |
| 42.9V | 10% | Very low power. The BMS is getting ready to shut things down. |
| ~42.0V | 0% | BMS cut-off. The motor will stop to protect the battery from damage. |
This table is your best friend for gauging your battery's health and planning your trips. By checking the voltage before a ride, you can set realistic expectations and avoid getting stranded with a dead battery.
Interpreting Battery Charge and Discharge Curves
While a static voltage chart is a great starting point, the real story of your eBike's performance is told through its charge and discharge curves. Think of these curves as a visual EKG for your battery, showing how its voltage changes in real-time as you charge it up or drain it on a ride.
These graphs do a fantastic job of explaining a common experience: your bike feels incredibly zippy for most of the ride, only to feel like it hits a wall right at the end. For a standard 48V Lithium-Ion battery, the voltage doesn't drop in a straight, predictable line. It starts at a peak of 54.6V, dips slightly right off the bat, and then settles into a long, impressively flat "plateau."
This plateau is the sweet spot. It's where your battery will spend the vast majority of its time, delivering a consistent voltage that translates directly to steady, reliable power at the motor. The voltage only takes a nosedive when the battery is almost completely empty, plummeting towards the low-voltage cutoff.
The Shape of Performance
The unique shape of this curve is a signature of modern battery chemistries. The flatter that plateau is, the more consistent your eBike's power will feel for most of your ride. This is a huge leap forward from older battery technologies, which had a much more linear, downward-sloping curve that meant your power would noticeably fade as your trip went on.
Let's look at a typical 48V lithium-ion pack. When fully charged to 54.6V (100% SOC), it maintains a steady plateau around 48-50V for about 80% of its capacity. After that, it tapers off quickly toward the 42V cutoff, where power drops off to prevent cell damage. This curve isn't set in stone, though; it shifts as the battery ages.
After 500 cycles, for example, the battery's internal resistance can creep up by 20-50%. This effectively reduces your usable range by up to 15% on a 20Ah pack. Suddenly, a reliable 40-mile ride becomes a 34-mile one.
Factors Affecting The Curve
It's also crucial to remember the potential damage from fast charging, which can permanently alter these curves.
How you charge your battery really matters here. Regularly slamming it with a high-amperage fast charger puts a lot of stress on the internal cells, causing internal resistance to build up faster. Over time, this makes the discharge curve steeper, meaning you get less peak performance and a shorter overall lifespan from your pack.
How to Measure Your eBike Battery Voltage Accurately
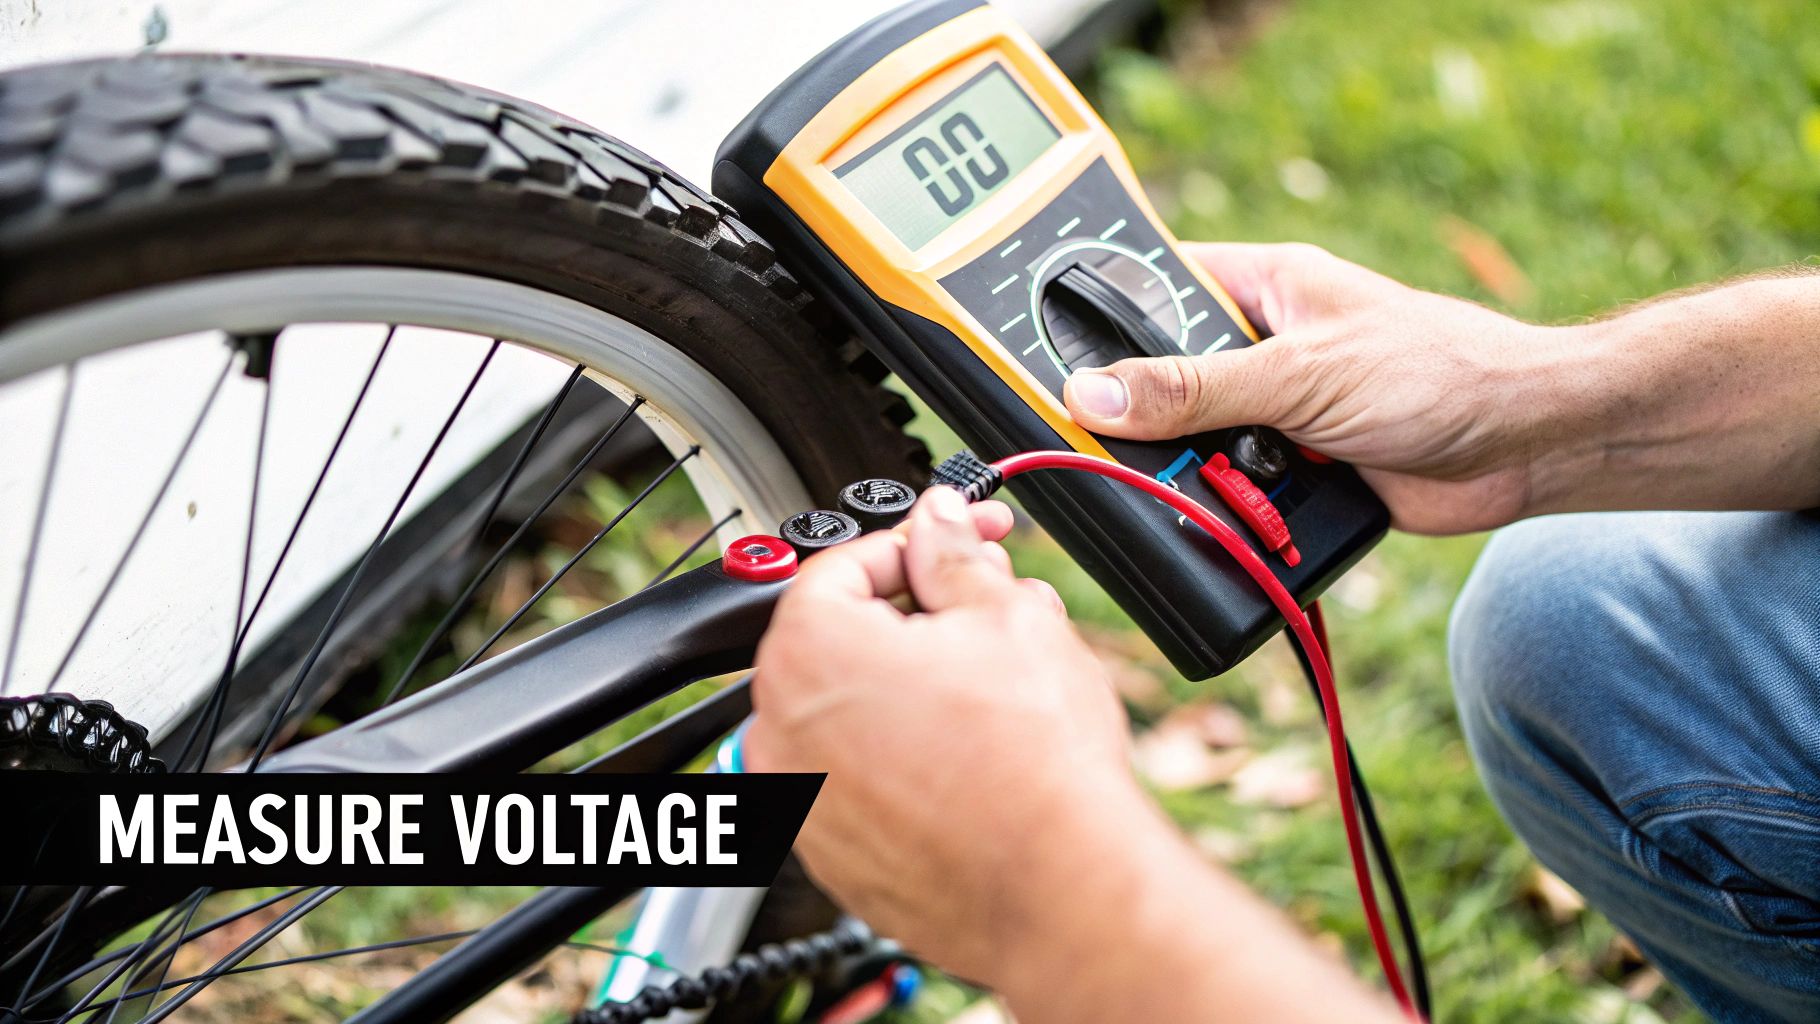
While your eBike's display gives you a decent idea of your battery level, nothing beats the precision of a digital multimeter. Taking a direct voltage reading is the gold standard for truly understanding your battery's state of charge.
Think of it as the ultimate diagnostic tool. It lets you sidestep any potential guesswork from your bike's built-in battery meter and gives you the hard data you need to check your pack's health or troubleshoot charging problems. With this number in hand, you can compare it directly to a battery voltage chart to see exactly where you stand.
Step-by-Step Multimeter Guide
Getting an accurate reading is simple, but you need to follow the steps carefully to do it safely. If you're curious about the charging equipment itself, we have a complete guide covering the ins and outs of electric bike chargers.
- Set Up Your Multimeter: First, turn the dial on your multimeter to the DC Voltage setting. Look for the symbol with a V and a straight line (or ⎓). You’ll need to select a voltage range higher than your battery's fully charged voltage. For instance, if you have a 48V pack that charges up to 54.6V, the 200V setting on the multimeter is the perfect choice.
- Access the Discharge Port: Remove the battery from your eBike. You're going to test the main discharge connector—that's the larger port that connects to the bike's controller, not the small, separate charging port.
- Connect the Probes: Now, carefully touch the multimeter probes to the terminals inside the discharge port. Insert the red (positive) probe into the positive terminal and the black (negative) probe into the negative one.
- Read the Voltage: Look at the multimeter's screen. It will show you the precise, real-time voltage of your battery pack.
Safety First: Be extremely careful to never let the metal tips of the red and black probes touch each other while they are connected to the battery terminals. This will cause a short circuit, which can create a dangerous spark, damage your battery's internal circuitry, and potentially harm your multimeter.
Voltage Charts for Other Common eBike Batteries
While 48V NMC packs are definitely the most common kid on the block, they're far from the only battery you'll run into. To make this guide genuinely useful, we need to look at the other chemistries and setups out there. You’ll often find these on commuter bikes, custom DIY projects, or older eBikes.
Knowing how to read their specific voltage is crucial for getting the most out of them.
Every battery chemistry has its own personality, and you can see it in its discharge curve. This is exactly why a one-size-fits-all battery voltage chart just doesn't work; you really need one that matches your pack's specific technology. These distinctions are especially critical if you're a DIY builder, a topic we dive into in our guide to building an eBike from scratch.
36V Lithium-Ion (NMC) Packs
You’ll see the 36V pack on a ton of popular commuter and entry-level eBikes. Think of it as the 48V battery’s smaller sibling. It’s almost always built with a 10-series (10s) cell configuration.
| Voltage (V) | Estimated State of Charge (%) |
|---|---|
| 42.0V | 100% |
| 39.5V | 80% |
| 37.0V | 50% |
| 34.5V | 20% |
| 30.0V | 0% (Cut-off) |
The voltage behavior is very similar to its bigger 48V brother. You get that initial quick drop, a long and stable mid-range, and then another sharp fall-off right at the end of the charge.
LiFePO4 (Lithium Iron Phosphate) Packs
Riders love LiFePO4 batteries for two big reasons: incredible cycle life and top-notch safety. They can often handle thousands of charge cycles. But they have a weird quirk—their voltage curve is notoriously flat, which makes guessing the remaining charge a real headache.
A LiFePO4 battery might hold almost the exact same voltage from 80% all the way down to 20%. What this means for you is that the battery meter on your display will barely move for most of your ride, and then suddenly plummet as you get close to empty.
Because of this, you have to be much more conservative with your range estimates when riding with a LiFePO4 pack. Don't trust the display blindly.
Lead-Acid Batteries
Let's be honest: lead-acid is old-school tech. It’s heavy, inefficient, and pretty much obsolete on modern eBikes. That said, you might still find these batteries on very old or extremely low-budget models.
Their voltage is super sensitive to load—meaning it sags significantly when you accelerate—and you can permanently damage them with deep discharges. The best practice here is simple: recharge them after every single ride, no matter how short. For a typical 36V lead-acid setup (three 12V batteries), you should never let the resting voltage fall below 36.3V if you want it to last.
Got Questions? eBike Battery Voltage FAQs
Got a nagging question about your eBike's battery voltage? You're not alone. Here are some quick, real-world answers to the questions we hear most often.
What’s the Best Voltage for Storing My eBike Battery?
For the long-term health of your lithium-ion battery, you want to store it with a 40-60% state of charge. Think of it as putting the battery into a comfortable hibernation state.
For a typical 48V pack, this sweet spot is a resting voltage between 46.8V and 49.4V. Letting it sit fully charged or completely dead for weeks on end is one of the fastest ways to wear it out and shorten its lifespan. We dive deeper into this in our guide to extending your battery's life.
Why Does My Battery Voltage Plummet When I Hit a Hill?
Ever watched your battery meter drop like a stone on a steep climb? That's a classic case of "voltage sag," and it's completely normal.
When you demand a lot of power from the battery—like when the motor is working its hardest—the battery's internal resistance causes the output voltage to dip temporarily. The steeper the hill, the more dramatic the sag. Don't panic; the voltage will bounce right back to its normal resting level as soon as the load eases up.
Can I Put a 52V Battery on My 48V eBike?
This is a really common but tricky question. While a 52V battery can often work with a 48V controller, it’s a gamble. A fully charged 52V pack hits about 58.8V, which might just be within the tolerance of your 48V controller.
However, running components over their intended voltage can definitely stress them out and will almost certainly void your warranty. Before you even think about this upgrade, you absolutely must check your controller’s maximum rated voltage. Frying your electronics is an expensive mistake.